ALICE:fractions
ALICE:fractions investigates whether modern teaching and learning approaches in the field of fractions can be implemented in an interactive framework on the iPad.
Taking into account different capabilities that tablets as digital tools offer, we want to create an eBook to help students to get a grasp on fractions.
Therefore, one of our main approaches is to implement interactive content in our book. Here, interactive diagrams should help students to investigate new content on their own, whereas different interactive tasks can be used to practice the newly-learned content.
We designed interactive tasks to adapt task difficulties according to the students' prior answers and to give feedback based on the students' individual mistakes. Moreover, some tasks are able to provide hints which students can view step by step.
Team
Two chairs of the Technical University of Munich cooperate on the project. Three PhD-stduents and two professors are involved.
Samples of interactive content
Please note that the widgets are extracted from the eBook and are therefore optimized for touchscreen-use.
⚠ The widgets were designed for a screen resolution of 1024 ✗ 768 px. You seem to be using a smaller device. We cannot guarantee a complete view or full functionality.
Empirical study
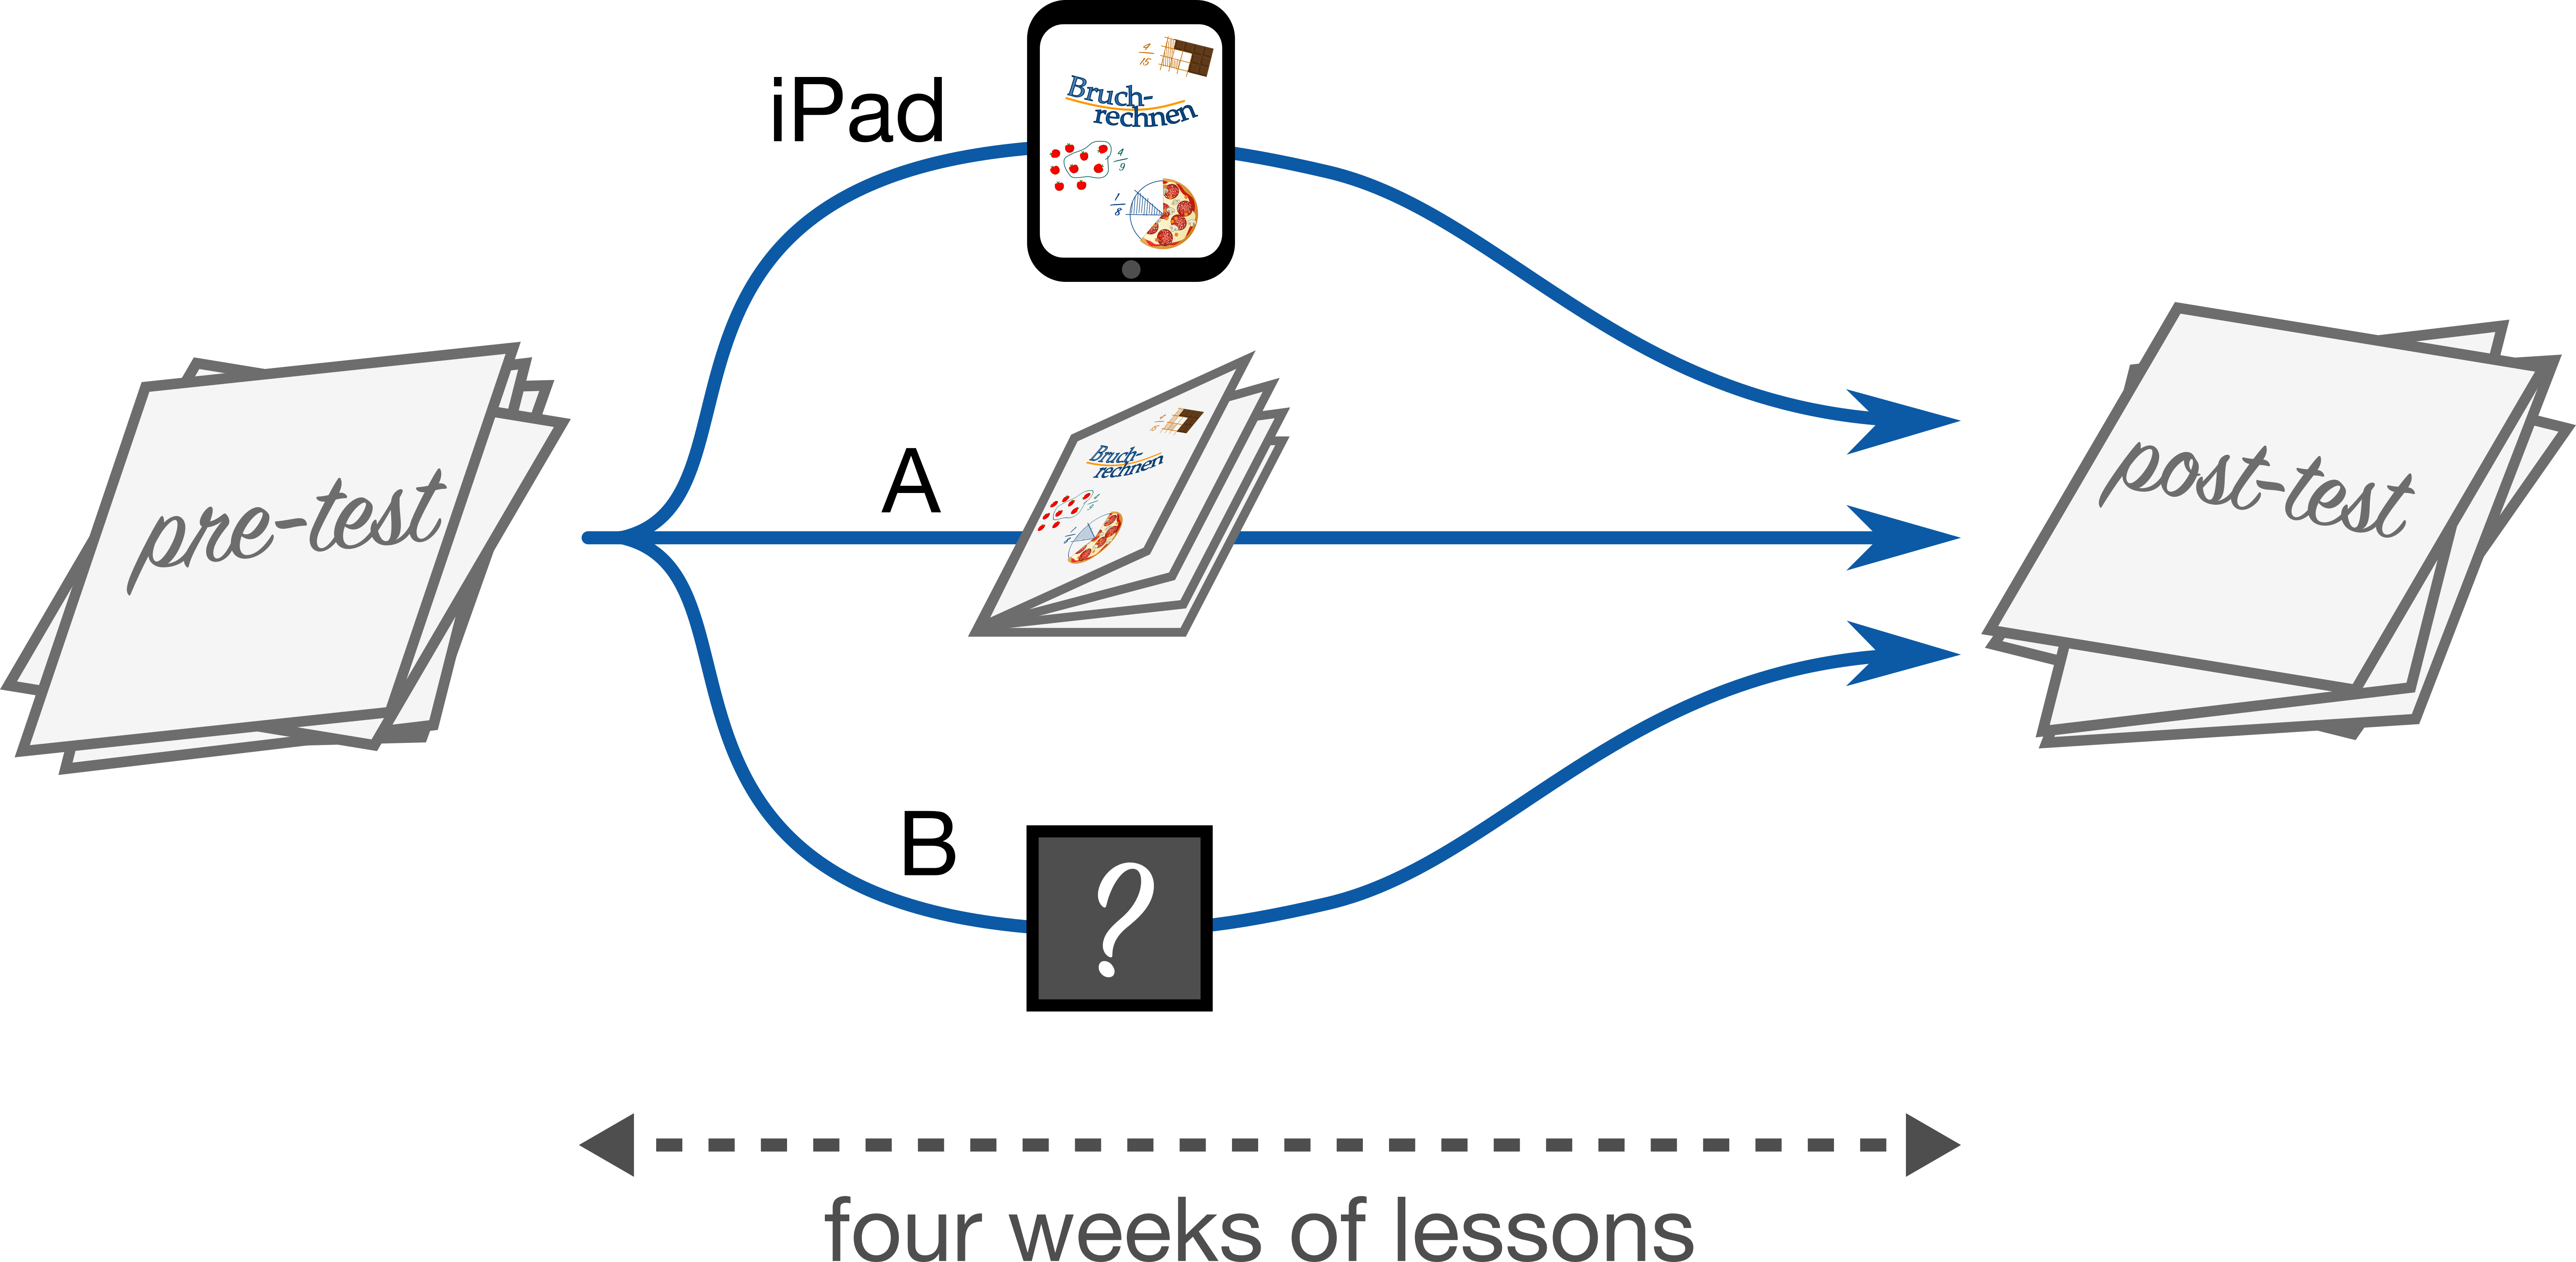
Split into three groups, sixth grade students from German public schools (highest track) participated in a four-week intervention on fractions:
- Treatment group 1 (iPad group) worked with an interactive environment on iPads,
- Treatment group 2 (paper copy group) received the same material as a regular paper-based book.
- Control group used conventional textbooks to control for effects of the material.
To control for effects of prior knowledge of fractions a pretest was conducted before the intervention. Posttest items were created according to mental models (part of the whole, expanding and reducing, comparing the size) and the mathematical competencies of visualization and calculation. We investigated whether there are differences between the three groups after the intervention.
Process data
Besides two written tests, we collect process data from iPad group students in various interactive tasks. We think that this will provide insights into students' learning processes and their solution strategies.
Please choose a task to see which kind of process data we can currently collect. Beneath the orange line you see the data collected from your recent experiments with the tasks above.